After controlling for inflation in education costs, Pennsylvania’s public school districts are funded below the funding level they were 26 years ago. How far school funding has fallen depends on how we measure spending on education and what measures of inflation we use. But no matter how you measure these things, by and large, the state’s funding for schools has decreased.
One way of measuring changes in state funding for education is to look at trends in the amount of Basic Education Funding (BEF). BEF is the primary way that the state aids local school districts. Starting with the oldest available revenue data on the Pennsylvania Department of Education (PDE) website, the BEF was $3.09 billion in 1994 and rose to $6.65 billion in 2019-20, the latest year for which funding data is available.
The second way of measuring changes in state funding for education is to look at all the funding that school districts receive from the state, including pension contributions and aid for special education and other programs as well as BEF, and then to adjust for some significant changes in school funding that occurred between 1993 and to today. In 1993-94, the total state support for school districts was approximately $4.36 billion. In 2019-20, Pennsylvania school districts received about $12.14 billion from the state. However, to fairly measure changes in state funding of education, we must adjust these total spending figures for variations in what is included in this overall total.
The 2019-20 state funds for schools include a $2.34 billion contribution to the Pennsylvania Retirement System for Public School Employees (PSERS). State contributions to PSERS were not included in 1993-94 state funding for school districts, so we should remove them from the $12.14 billion if we want an accurate comparison to 1993-94. (We could also add those costs to the 1993-94 data in an appropriate way. In appendix 2 we attempt to do this and find that the results are not substantially different from what we report in the body of this paper.)
Another adjustment we must make is to charter school funding. In 2019-20, school districts were mandated by state law to pass $2.19 billion on to charter schools. Charter schools did not exist in Pennsylvania in 1993-94, so all $4.36 billion of the revenue that school districts received from the state went to the schools run by the districts. An apples-to-apples comparison would not include the $2.19 billion that passes through school districts to charter schools. So a more accurate point of comparison to 1993-94’s $4.36 billion is $12.15 billion minus $2.34 billion for pensions minus $2.19 billion for charter schools which equals $7.62 billion in 2019-20.
These figures all need to be adjusted for inflation, but how to do so is not a trivial question. We consider three measures of inflation (table 1).
The most common way to adjust for inflation adjustment is to use the Consumer Price Index (CPI) “all items” measure produced by the Bureau of Labor Statistics (BLS). This is not an appropriate measure in this case, however. The CPI is specifically designed to capture all changes in the cost of living, including goods and services that become relatively more expensive and relatively cheaper over time. Education, like other goods and services that are created by highly educated and / or skilled workers—teachers and administrators in this case—tends to become relatively more expensive over time because it cannot be produced more efficiently through automation or other technological improvements. Furthermore, these positions cannot be transferred offshore to cheaper labor markets. This means the cost of education has risen much faster over the past few decades than the price of other goods and services that go into the CPI such as computers or agricultural products. It would be inaccurate to use the general CPI (“all items”) to adjust for the rise in the cost of education, and it is only included in this report for the sake of comparison.
A more germane index is the CPI-U education measures which captures growth in the cost of education-related items such as tuition for private schools. It has grown twice as fast as the CPI-U all items. While this measure of inflation is certainly more accurate than general CPI-U it may overstate inflation in education if, say, private schools provide significantly more services or better physical facilities over time.
Pennsylvania has its own education inflation index called the Act 1 index. This index is rooted in state law where it serves to regulate how much school districts can raise their taxes each year. It is based on elementary and secondary school labor costs nationwide and on the change in weekly wages in Pennsylvania. Of all the inflation indices examined, it is the inflation index that is most closely tied to the cost of providing K-12 education in PA as it restricts the rate at which spending can grow and is thus the official state measure of the cost of education. If we extend it back to 1993-93, we find it, too, grows noticeably faster than the CPI all items, though not at the breakneck pace of the CPI’s education category.
Table 1. Three measures of inflation in education cost

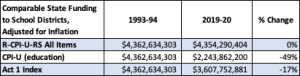
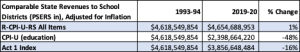
Using these various measures of inflation, we see that between 1993-94 and 2019-20 the inflation-adjusted total state funding of public school districts did not change when measured by the general CPI all items index. Instead, it went down by 49% according to the CPI-U education index and 17% according to the Act 1 index significantly according to the education-specific inflation index (table 2). Even if we did not exclude charter school funding from total education spending in 2019-2020 from this analysis, total school funding only grew 8% over 26 when indexed to the Act 1 index, only .31% a year. And indexed by CPI-U (education), it shrank by 33%.
Table 2. State funding for K-12 education (excluding pension and charter school costs) between 1993-94 and 2019-2020 under three measures of inflation
If we measure state spending on education by the BEF alone, it grew by only 2% over 26 years, or less than .08% per year and shrank by over a third when adjusting with the CPI-U education index (table 3).
Table 3. State basic education funding (BEF) between 1993-94 and 2019-2020 under three measures of inflation

A recent analysis by the Commonwealth Foundation asserted that inflation-adjusted state funding grew far more quickly than we find year. Our analysis demonstrates that BEF spending has been effectively flat since 1993 and, after adjusting for expenditures that do not reach students in public school classrooms and for inflation, net state funding of public schools has actually gone down.
Total state support for public schools is only a part of the story. Though it is outside the scope of this piece, it is important to remember that expectations of our public schools have also grown since 1993. For example, we expect more and higher quality special education and early education programs, as well as higher standardized test scores. Not only are school districts receiving less money from the state once adjusted for inflation, but they must do more with it. (The higher expectations for our public schools give us some justification for using CPI-U (education) because our index of inflation for public schools, like private schools, is expected to do far more for students now than 25 years ago. Yet the costs of private school education have gone up far higher than public school education.)
There are many ways of measuring how Pennsylvania’s funding of its public schools has changed. Unfortunately, they all tell us that the state has been failing the children of Pennsylvania.
Appendix 1: Notes on Methodology
Charter school payments in 2019-20 are found by summing all school district expenditures using the object code 562 in 2019-20 PDE detailed AFR expenditure data.
Data on 2019-20 state reimbursements for PSERS are found by summing revenue code 7820 “State share of retirement contributions” for all school districts. Data comes from the 2019-20 PDE detailed AFR revenue data.
Total state revenues for school districts and BEF data come from PDE AFR revenue data from 1993-94 and 2019-20.
All inflation adjustments adjust 2019-20 funding amounts to 1993 dollars by using one of three measures of inflation between 1993 and 2019.
For CPI all items, the R-CPI-U-RS was used. For the CPI-U (education) index, the education component of the CPI-U was used. Year averages were used when available; December values were used otherwise.
The Act 1 index is presented by the PDE as a yearly increase. The Act 1 index does not go back to the 1990s. To calculate it for 1990 we applied the definition of the Act 1 index to the appropriate year. The Act 1 index takes data from the BLS’s Employment Cost Index’s current nominal dollar series for civilian elementary and secondary workers. However, this series only goes back as far as 2000, so the BLS ECI continuous dollar series for state and local government elementary and secondary workers was used for the years before 2000. The yearly increase was then turned into an index by setting the value in 1993 to 1 and increasing that for every successive year by the yearly increase amount stipulated by the Act 1 index.
Appendix 2: Handling Retirement Contributions
Because state retirement contributions are part of state funding of schools for 2019-20 but not 1993-94, we decided to take them off the 2019-20 amount to maintain the integrity of the comparison. In this note, we show the results with state retirement contributions included in state spending after adjusting those contributions to exclude the amount the state currently spends to reduce the unfunded liability in the education pension fund, PSERS, which was created by underfunding of pensions for many years.
The Governor’s Executive Budget for 1995 includes a line item of $444 million for the state contribution to school workers’ retirement funds. This amount presumably includes the retirement contributions for workers at technical and career schools as well as for school district workers; but in 2019-20, state retirement contributions that went to technical and career schools were about 2% of the total, so it’s marginal. By including it we may be slightly overestimating the amount of school district retirement contributions paid for by the state in 1993-94.
In the late 1990s and for much of the 2000s, Pennsylvania was in the habit of underfunding its retirement systems. Because retirement benefits aren’t handed out until years after they are earned, the state often failed to put aside enough money to pay for the retirement benefits earned in a given year. This means that in later years the state not only had to make contributions to the pension system pay for all the retirement benefits earned in that year but also pay underfunded retirement benefits to make up for the contributions it didn’t make in the years in which the pension benefits were earned.
Roughly, the amount of retirement benefits already earned that the state hasn’t put aside money for is called the unfunded accrued liability. In 2019-20, according to the actuarial section of the PSERS annual financial report, 78% of the cost of employer contributions was to make up for the unfunded accrued liability. That means only 22% of the employer contributions were paid for benefits earned by employees in 2019-20. In 1993-94, 42% of the employer contribution was due to unfunded accrued liability. We assume that the state’s share of retirement contributions is independent of how much of the employer’s contribution goes to reducing the unfunded liability. We also assume that the state paid the entire actuarially determined contribution in both 1993-94 and 2019-20. (We know this is true for 2019-20.) This allows us to conclude that 42% and 78% respectively of 1993-94’s and 2019-20’s state retirement contributions were due to unfunded accrued liabilities. The remaining 58% and 22%, then, are better indicators of how much the state contributed for retirement benefits earned in the fiscal year, which is called the normal cost of pensions.
Once we remove funds that go to reduce the unfunded liability, the 1993-94 state retirement contributions for that year come to $256 million, and the 2019-20 contributions come to $567 million. If we add the $256 million to the 1993-94 school district funding received by the state and replace the $2.34 billion total cost with the $567 million normal cost of pensions for 2019-20, we get the results found in table 4.
Table 4. State funding for K-12 education (including normal pension and excluding charter school costs) between 1993-94 and 2019-2020 under three measures of inflation
Comparing table 4 with table 2 shows only a difference of one percentage point in our estimate of the change in state funding for K-12 education between 1993-94 and 2019-20. In this context, that is a negligible difference and does not change the conclusions drawn from the data presented in the body of the report.